Utilization reports for agencies
Utilization reports for agencies
Utilization per person and position, planned hours and cost per project, allocation conflicts, bench and time off. Built on the plan, exportable to Excel.
The problem
An agency lives on utilization, and most agencies learn their utilization once a quarter, from a spreadsheet somebody assembled from timesheets, after the quarter is over. By then the decision it should have informed (hire, don’t hire, take the project, say not yet) has already been made on a hunch.
The number also tends to be one number. Team utilization of 82 percent hides that QA is at 110 and design is at 60, and that one developer has been over capacity for six weeks.
How it works in PepperPlanner
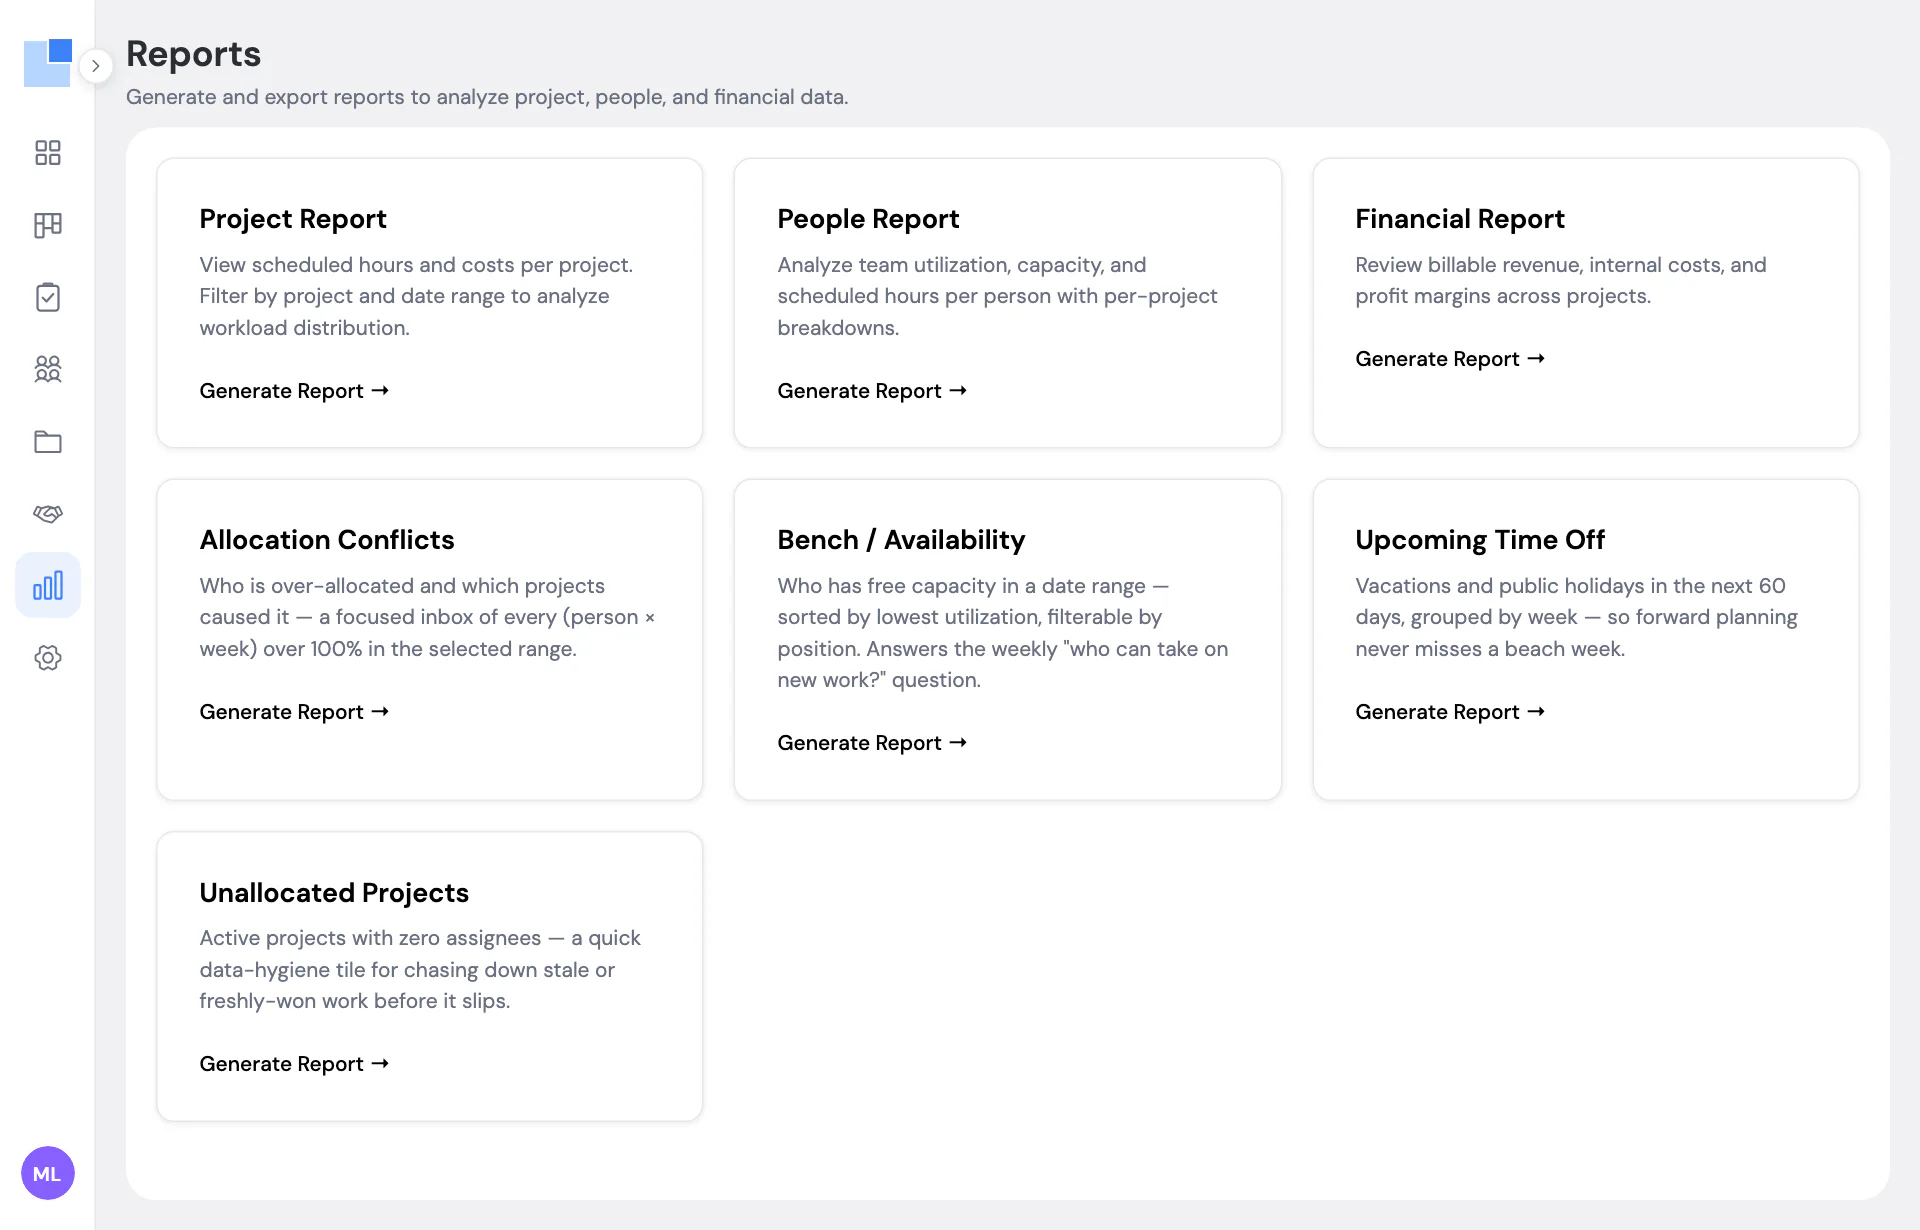
Reports read the same plan the Schedule shows, so they are available for any period, including the future. You can run the people report for next month today and see what utilization will be if nothing changes. There are seven of them.
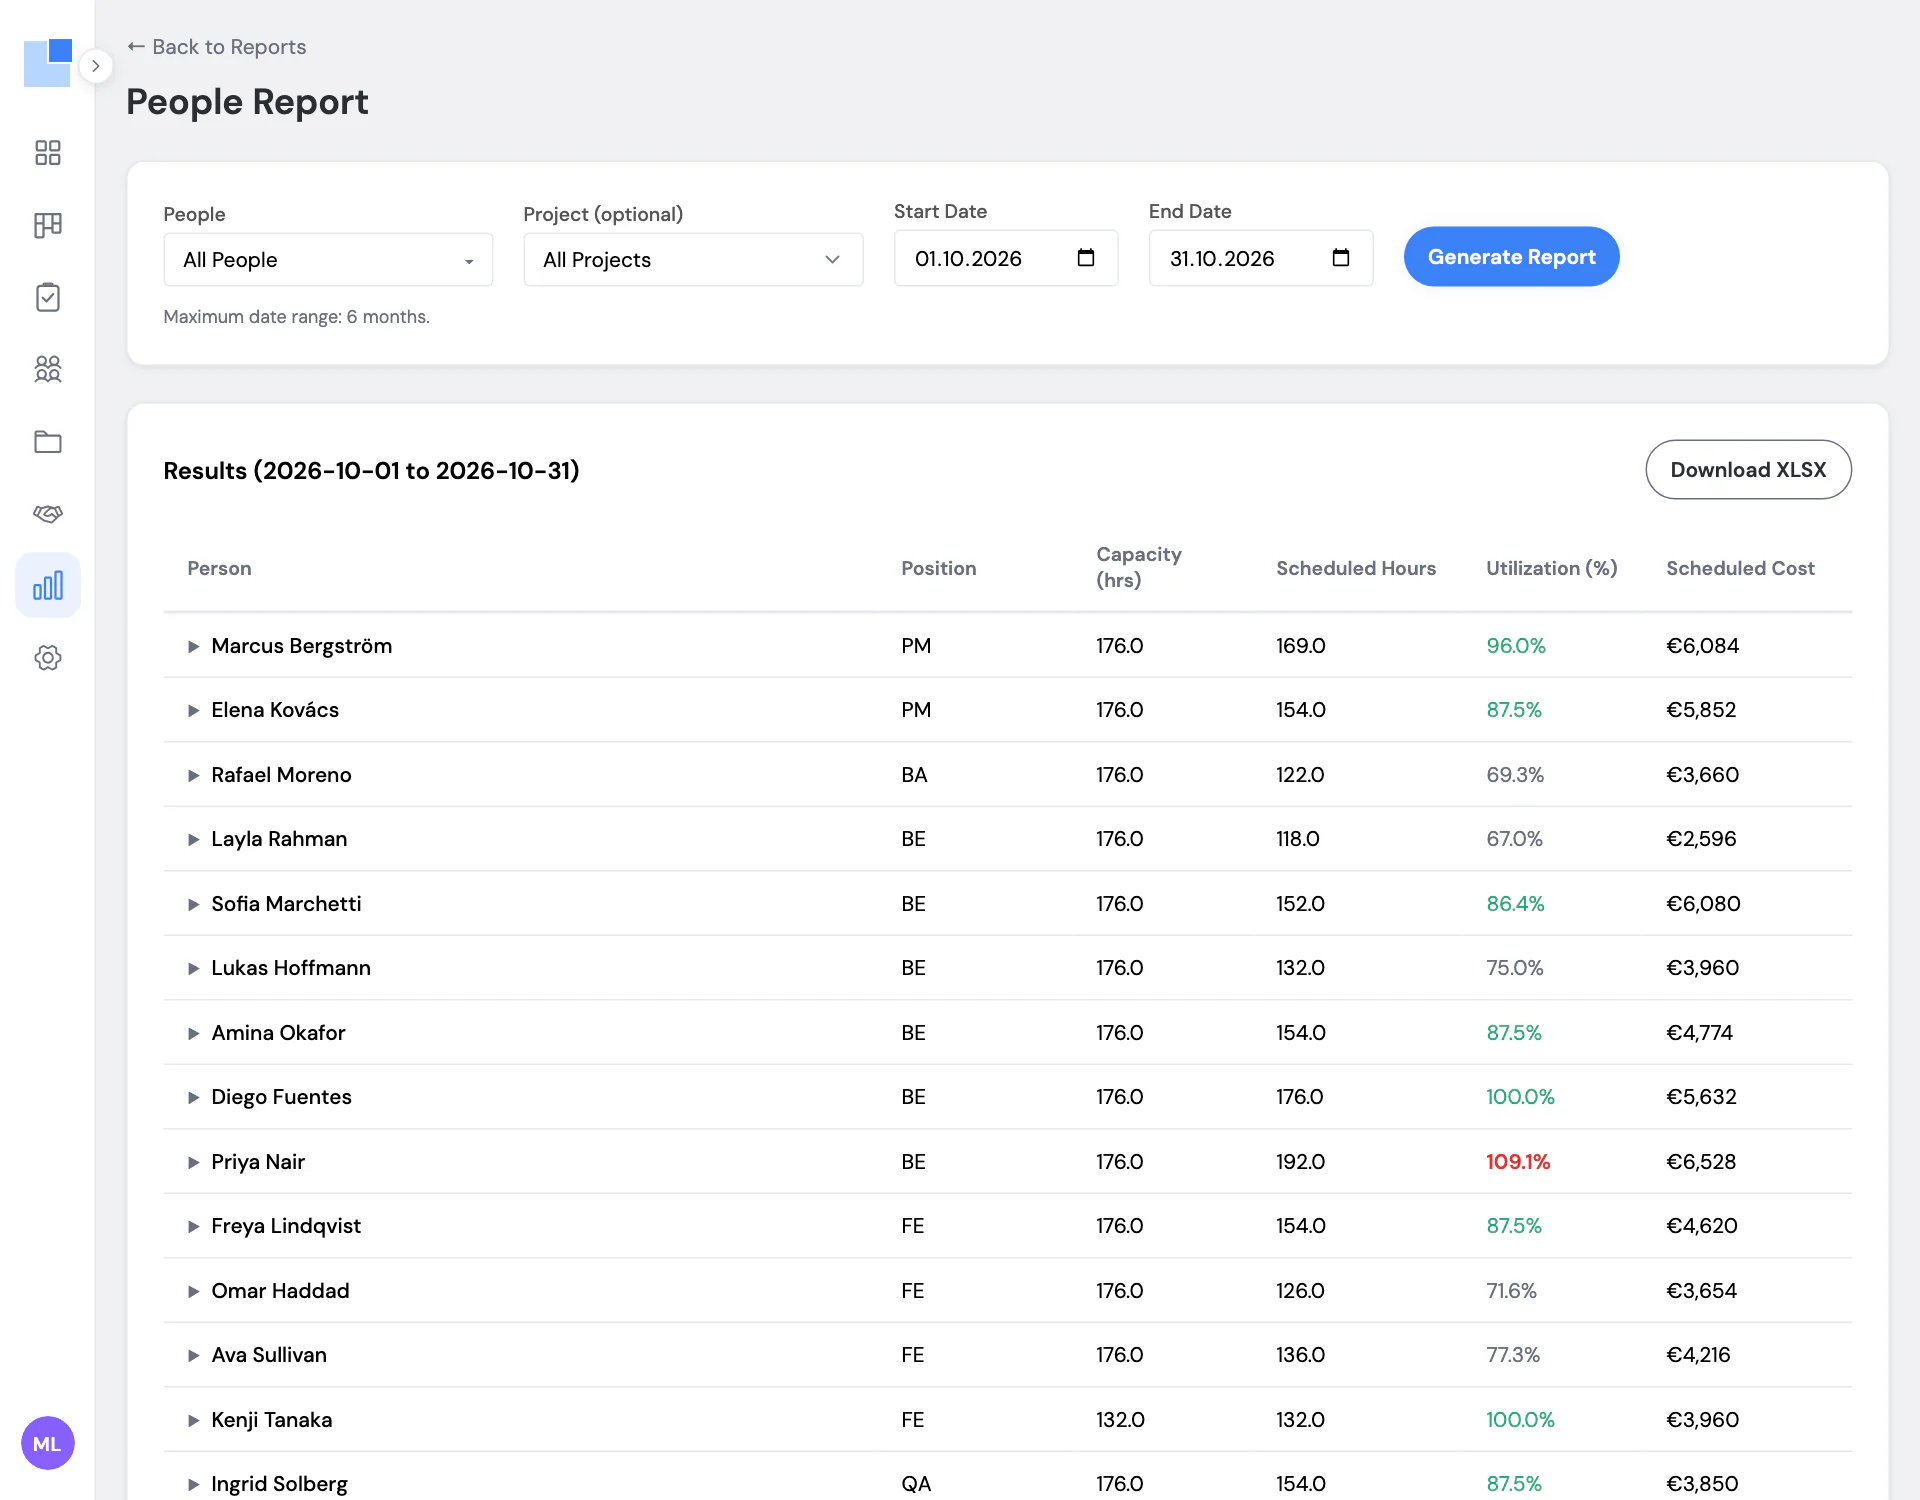
People is the utilization report. For a date range of up to six months, each person’s capacity, scheduled hours, utilization and scheduled cost, with a per-project breakdown under each row. Capacity accounts for daily hours, vacation and public holidays, so a part-timer and someone on leave are compared fairly. Over 100 percent is red.
Project turns the plan around: scheduled hours and planned cost per project, filterable by project and date, against the project’s budget. It is the report we open before a status call when the client asks whether the fixed price still holds.
Financial adds billable rates to cost rates: planned revenue, planned cost and margin per project. It is gated behind finance access, so a project manager can run every other report without seeing what anyone earns.
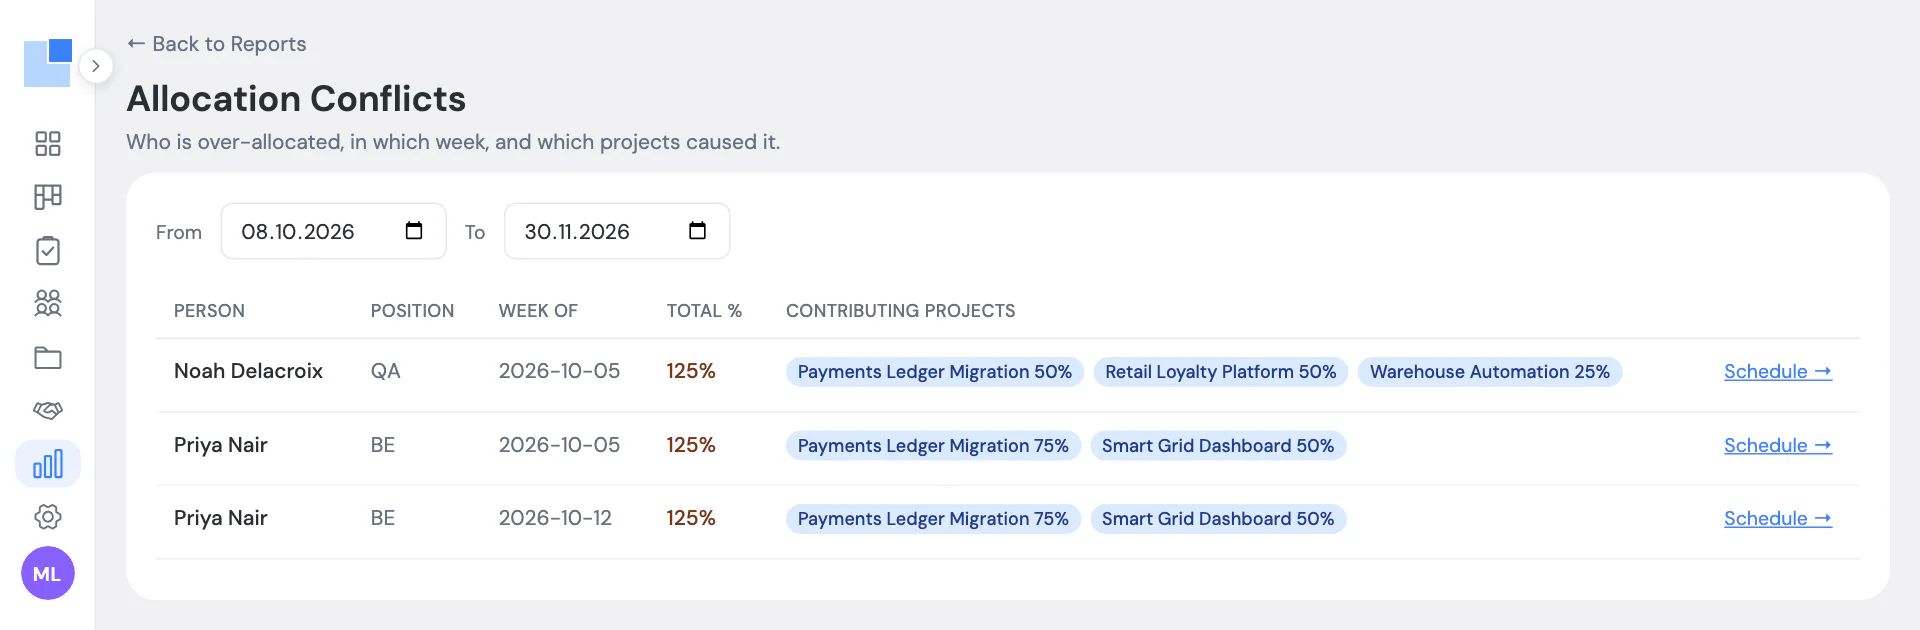
Allocation conflicts lists every person-week over 100 percent and the projects that add up to it, with a link to that week on the Schedule. It is the report to run on Monday morning.
Bench is the opposite list: who has free capacity in a range, sorted by lowest utilization, filterable by position. “Do we have a backend developer for three weeks in November” is a filter, not a meeting.
Upcoming time off shows vacations and public holidays in the next 60 days grouped by week, so a release date is never set on a week when half the team is away. Unallocated projects lists active projects with nobody on them, usually a freshly won project that has not been staffed yet or a project that should have been closed.
The project, people and financial reports download as an Excel file. Everything else is on screen. There are no charts yet; the tables are what we use, and they are honest about being built on planned hours rather than worked ones.
Questions we get about this
Is this based on timesheets?
No. Every report is built on the plan: allocations, daily hours, rates and budgets. PepperPlanner has no time tracking. The reports answer what was planned and what it will cost, not what was logged.
How is utilization calculated?
Scheduled hours divided by capacity for the period. Capacity is daily hours times working days minus vacation and public holidays. A person with 8-hour days and a week of vacation in a 22-day month has 136 hours of capacity, not 176.
Can I export a report?
Yes. The project, people and financial reports download as an Excel file with the same rows and the per-project breakdown.
Who can see costs and margins?
Cost rates, billable rates and the Financial report are visible to workspace owners and to users given finance access. Everyone else sees hours and utilization without money.
What is the bench report?
People with free capacity in a date range, sorted by lowest utilization and filterable by position. It is the answer to 'can we take this project on' when the question comes in.
From the blog
-
Why we built our own resource planner instead of buying one
A 20-person software agency, one long Google Sheet, and three planning questions it could not answer. How PepperPlanner started and what it fixes.
Other features
-
Resource scheduling for agencies
Hourly allocations on one timeline, by person or by project, with totals that turn red when someone is over.
-
Capacity planning dashboard with overbooking alerts
Utilization, free hours, and who is over or under, for this week, next week or the month, with live alerts.
-
Weekly project status reports and daily team digest
A three-minute weekly status per project, all on one page, and a morning digest of exceptions in your team chat.
PepperPlanner is the planner we built for our own 20-person agency. Free for 5 people, €3 per user after that.
Get started free All features