Capacity planning dashboard with overbooking alerts
Capacity planning dashboard with overbooking alerts
Team utilization, available hours and who is overbooked, this week or next. Double-booking and over-allocation show up while you plan, not in the retro.
The problem
Double-booking does not look like a mistake when it happens. It looks like two cells that each make sense: 6 hours a day on the migration, 4 hours a day on a bug fix for another client. Nobody adds them up until the developer is working ten-hour days and the second project slips.
The other half of the problem is the opposite. Somebody has been quietly at 50 percent for three weeks, and the sales call that could have used them ended with “we are full right now”.
Both questions need the same thing: a total per person that updates when the plan changes, and a place where the totals that are wrong rise to the top.
How it works in PepperPlanner
The Dashboard reads the Schedule and shows the team’s capacity for a period: this week, next week, this month, next month. Team utilization, available hours, the number of people over capacity, the number with low utilization, and how many are on vacation.
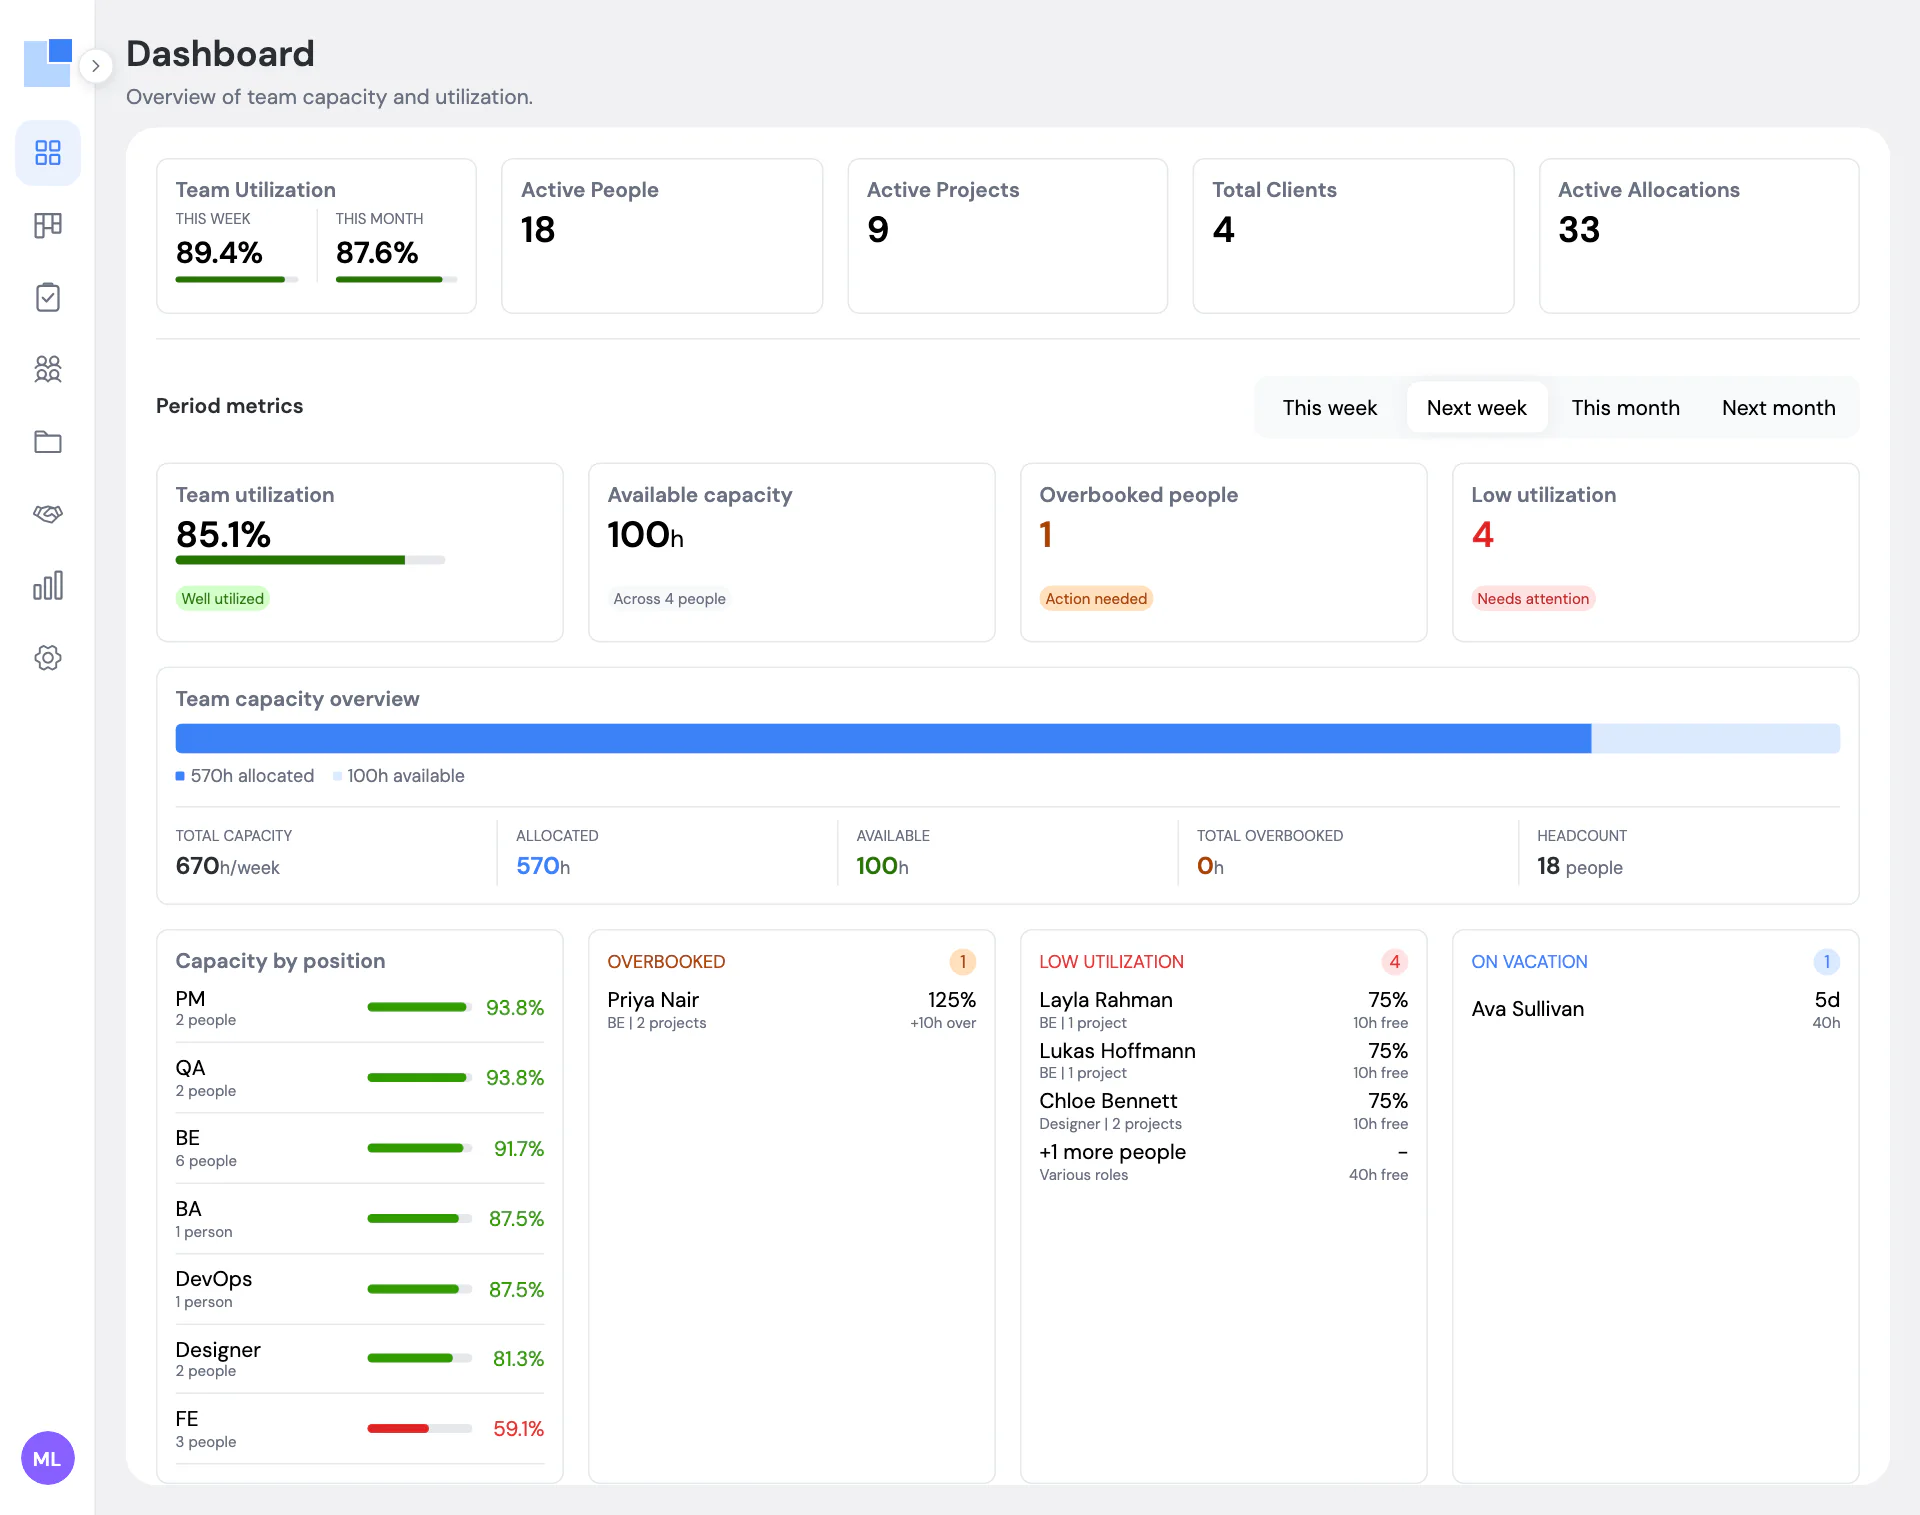
Below the numbers are the lists that make them actionable. Overbooked shows each person over capacity, by how many hours and on how many projects. Low utilization shows who has room and how much. On vacation shows who is away and for how long. Capacity by position breaks utilization down by PM, developer, QA, designer and whatever positions you use, so you can see that QA is at 106 percent while design is at 81 before it becomes a problem.
The alerts are not a separate feature; they are the same arithmetic surfaced where you are. On the Schedule, a person’s total turns red the moment an allocation pushes them over, and the overlapping bars are highlighted. On the Dashboard they are listed. In the daily digest, if you turn it on, they are posted to your team chat in the morning.
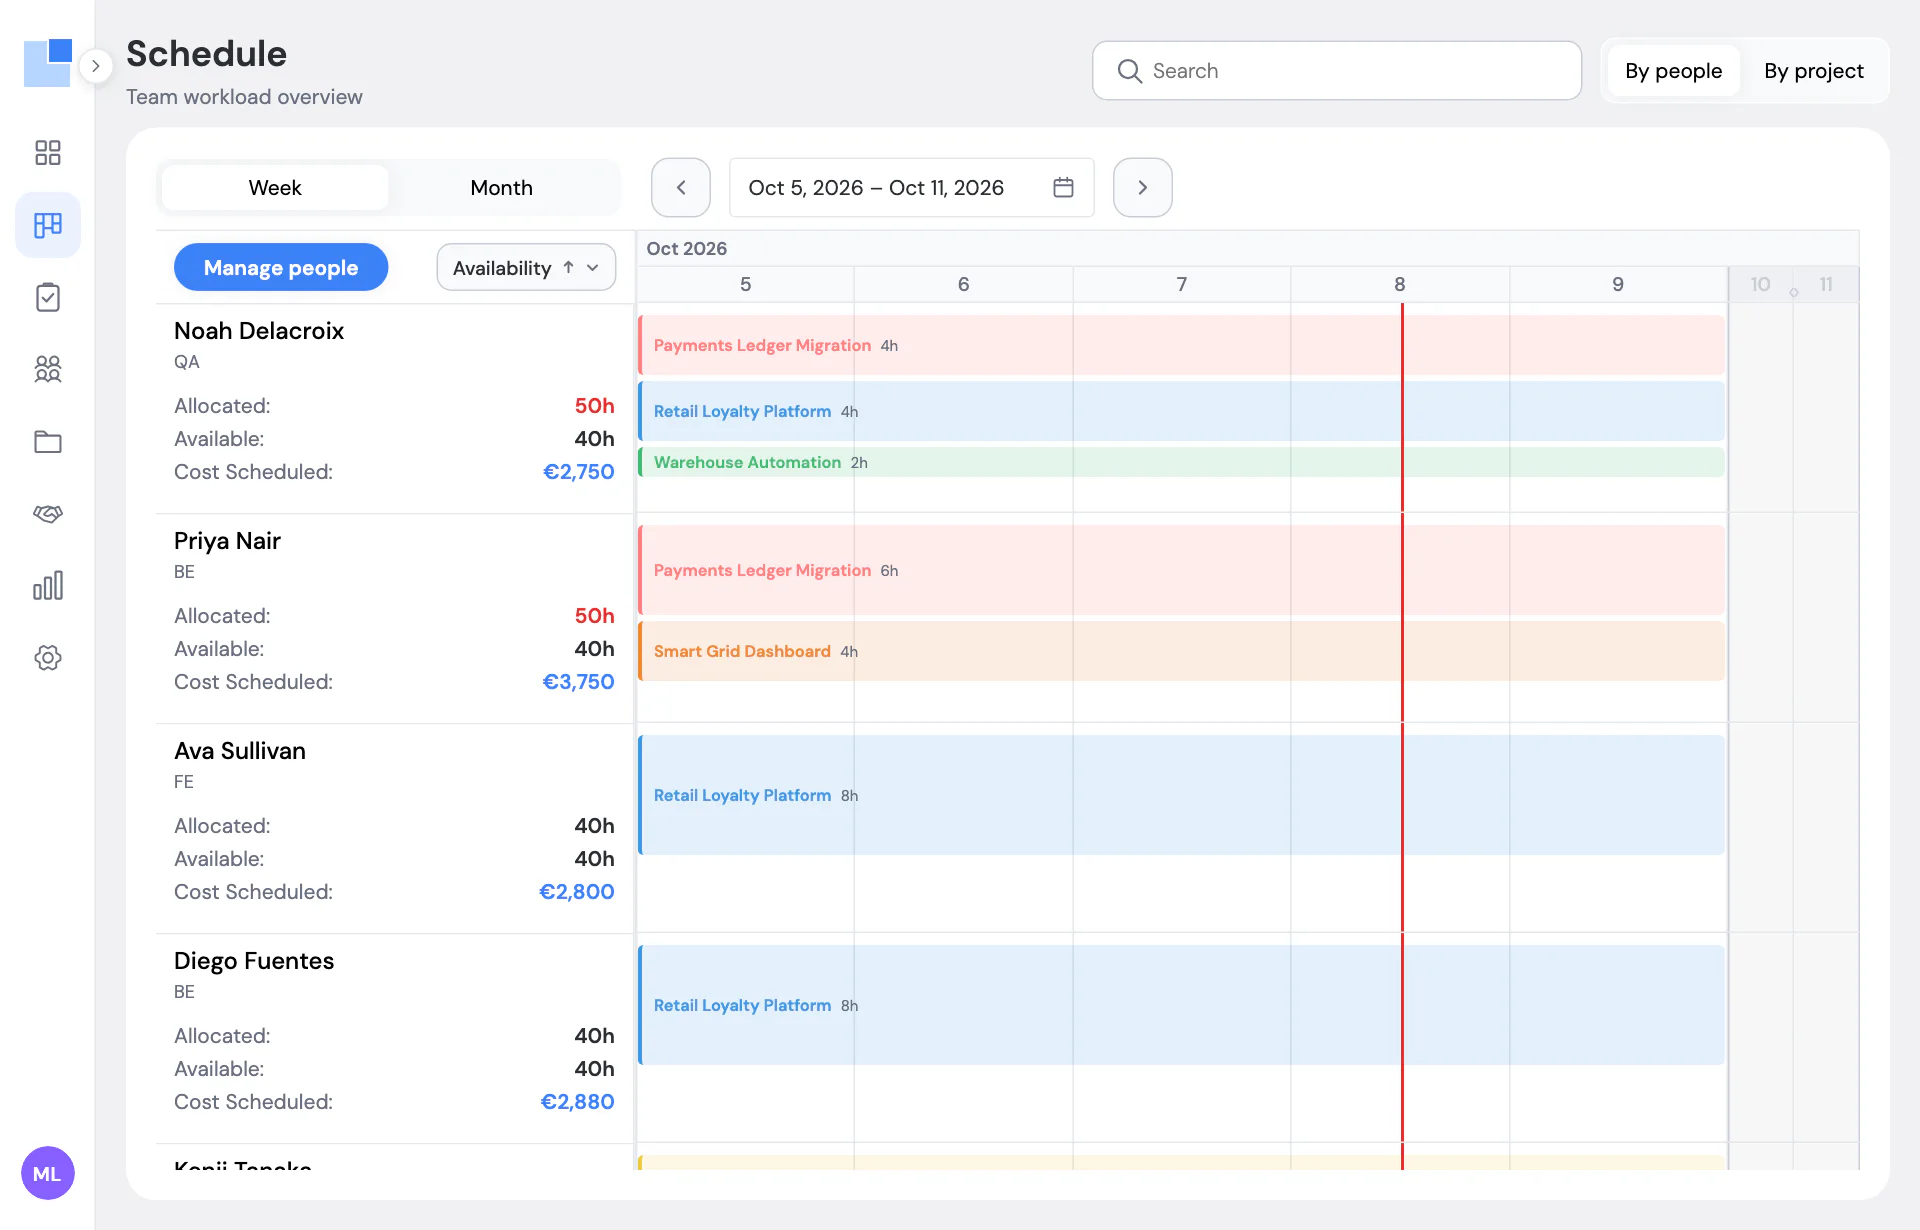
Capacity respects time off. A person on vacation next week has zero available hours, so a bar planned across that week is a conflict, not a plan. Public holidays reduce everyone’s capacity for the day. A person with 6 daily hours has a 30-hour week, not 40.
We look at “next week” more than “this week”. This week is already happening; next week can still be moved. The Friday ritual at Peppernode is to open next week, fix anything red, and find a project for anyone with more than a day free.
What the Dashboard does not do: it does not know what was actually worked. It is a view of the plan. If the plan says 40 hours and the person did 30, the dashboard still says 40. That is on purpose; we chose a planner, not a timesheet, and the reports are built on the same planned numbers.
Questions we get about this
What counts as overbooked?
More hours allocated than the person has available in the period. Available is daily hours times working days, minus vacation and public holidays. 6 hours on one project plus 4 on another against an 8-hour day is 125 percent.
Where do the alerts show up?
In three places: the person's total turns red on the Schedule as soon as you drop the bar, the dashboard lists them under Overbooked, and the daily digest posts them to your team chat the next morning.
Can I look at next week or next month instead of this week?
Yes. The period switch has this week, next week, this month and next month. Next week is the one worth checking on a Friday, because it can still be changed.
Does the dashboard count part-time people?
By default it counts full-time people only, so a part-timer at 20 hours does not drag the team average down. A workspace setting includes them if you prefer.
What is the low-utilization list for?
It shows people with free hours in the period and how many. It is the first place to look when a new request comes in, and the honest answer to 'is anyone on the bench'.
From the blog
-
Why we built our own resource planner instead of buying one
A 20-person software agency, one long Google Sheet, and three planning questions it could not answer. How PepperPlanner started and what it fixes.
Other features
-
Resource scheduling for agencies
Hourly allocations on one timeline, by person or by project, with totals that turn red when someone is over.
-
Utilization reports for agencies
Utilization per person, planned hours and cost per project, conflicts, bench and time off, exportable to Excel.
-
Weekly project status reports and daily team digest
A three-minute weekly status per project, all on one page, and a morning digest of exceptions in your team chat.
PepperPlanner is the planner we built for our own 20-person agency. Free for 5 people, €3 per user after that.
Get started free All features